6.3 Representation of Thermodynamic Processes in  coordinates
It is often useful to plot the thermodynamic state transitions and the cycles in terms of temperature (or enthalpy) and entropy, ![]() ,
, ![]() , rather than
, rather than ![]() ,
, ![]() . The maximum temperature is often the constraint on the process and the enthalpy changes show the work done or heat received directly, so that plotting in terms of these variables provides insight into the process. A Carnot cycle is shown below in these coordinates, in which it is a rectangle, with two horizontal, constant temperature legs. The other two legs are reversible and adiabatic, hence isentropic (
. The maximum temperature is often the constraint on the process and the enthalpy changes show the work done or heat received directly, so that plotting in terms of these variables provides insight into the process. A Carnot cycle is shown below in these coordinates, in which it is a rectangle, with two horizontal, constant temperature legs. The other two legs are reversible and adiabatic, hence isentropic ( ![]() ), and therefore vertical in
), and therefore vertical in ![]() -
-![]() coordinates.
coordinates.
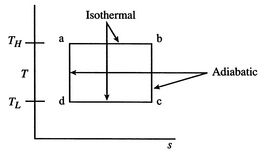
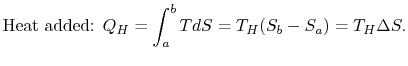
If the cycle is traversed clockwise, the heat added is
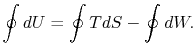
The work done by the cycle can be found using the first law for a reversible process:
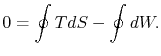
We can integrate this last expression around the closed path traced out by the cycle:
Muddy Points
How does one interpret ![]() -
-![]() diagrams? (MP 6.3)
diagrams? (MP 6.3)
Is it always OK to ``switch'' ![]() -
-![]() and
and ![]() -
-![]() diagram? (MP 6.4)
diagram? (MP 6.4)
What is the best way to become comfortable with ![]() -
-![]() diagrams? (MP 6.5)
diagrams? (MP 6.5)
What is a reversible adiabat physically? (MP 6.6)
Disusun Ulang Oleh:
Arip Nurahman
Pendidikan Fisika, FPMIPA. Universitas Pendidikan Indonesia
&
Follower Open Course Ware at MIT-Harvard University. Cambridge. USA.
Materi kuliah termodinamika ini disusun dari hasil perkuliahan di departemen fisika FPMIPA Universitas Pendidikan Indonesia dengan Dosen:
1. Bpk. Drs. Saeful Karim, M.Si.
2. Bpk. Insan Arif Hidayat, S.Pd., M.Si.
Dan dengan sumber bahan bacaan lebih lanjut dari :
Massachusetts Institute of Technology, Thermodynamics
Professor Z. S. Spakovszk, Ph.D.
Office: 31-265
Phone: 617-253-2196
Email: zolti@mit.edu
Aero-Astro Web: http://mit.edu/aeroastro/people/spakovszky
Gas Turbine Laboratory: home
Ucapan Terima Kasih:Kepada Para Dosen di MIT dan Dosen Fisika FPMIPA Universitas Pendidikan Indonesia
Semoga Bermanfaat


Tidak ada komentar:
Posting Komentar